Glake
Get in touch
Development · Marketplaces

AI operations monitoring agent

The system pulls data from the Wildberries seller account, calculates sales and advertising metrics, spots anomalies, and sends a Telegram summary that explains what caused them


MPstats
MPstats · product for Wildberries sellers
Discuss a similar projectAll case studies
AI operations monitoring agent
60+
metrics in every summary
4
breakdowns: business, category, brand, and product
4
baselines: plan, yesterday, last week, and the previous summary
90
days of history stored for every summary
01 · The challenge

What the client needed

MPstats is an analytics platform for marketplace sellers. For its audience of Wildberries sellers, we built a standalone product: a Telegram agent that monitors the store so the seller doesn’t have to.

Sellers need a daily read on how their business is doing: how many units sold, how ads are performing, what’s happening with returns and stock, where sales dipped and why. All of that data lives in the Wildberries seller account, scattered across several reports.

To see the full picture, sellers exported sales, advertising, returns, and stock reports and pieced them together in Excel — hours of work every day. And with hundreds of SKUs, they still couldn’t keep track of everything: figuring out which items were slipping and why meant digging through the data by hand.

Drops in sales or ad performance were spotted late, and tracking down the cause took even longer.

The data had to be collected automatically, and instead of a pile of numbers, the seller needed to see what matters: what changed, where the problem is, and what to do about it.

What stood in the way
Manual exports
Sellers exported sales, advertising, returns, and stock reports from their account and stitched them together in Excel — hours every day.
Missed dips
With hundreds of SKUs, it’s easy to miss a sales dip on one of them — and the cause then has to be dug out of the same spreadsheets by hand.
Numbers without insight
The metrics are there, but without an analyst it’s hard to tell what to do with them: no cause, no hint of where to look.
02 · The solution

What we built

01

Automatic data collection

The system automatically pulls Wildberries data: sales, orders, returns, stock, and finances. Sellers no longer export reports, and they set the collection schedule themselves.

02

Problems surface right away

Every day, a summary arrives in Telegram with a dashboard and a list of the biggest problems, with the ones that hit revenue hardest at the top. Metrics are calculated by business, category, brand, and product and compared against the plan and past periods. Sellers set alert thresholds and their sales plan in their own Google Sheet.

03

Explanations, not just numbers

For each problem, the system builds a hypothesis from that seller’s own data and suggests next steps. Sellers can ask follow-up questions in the chat in plain language and drill down to a specific product, and every answer is based on real data only.

03 · Demo

How monitoring works

Here’s what happens to the data, step by step — from collection to answering a question in Telegram.
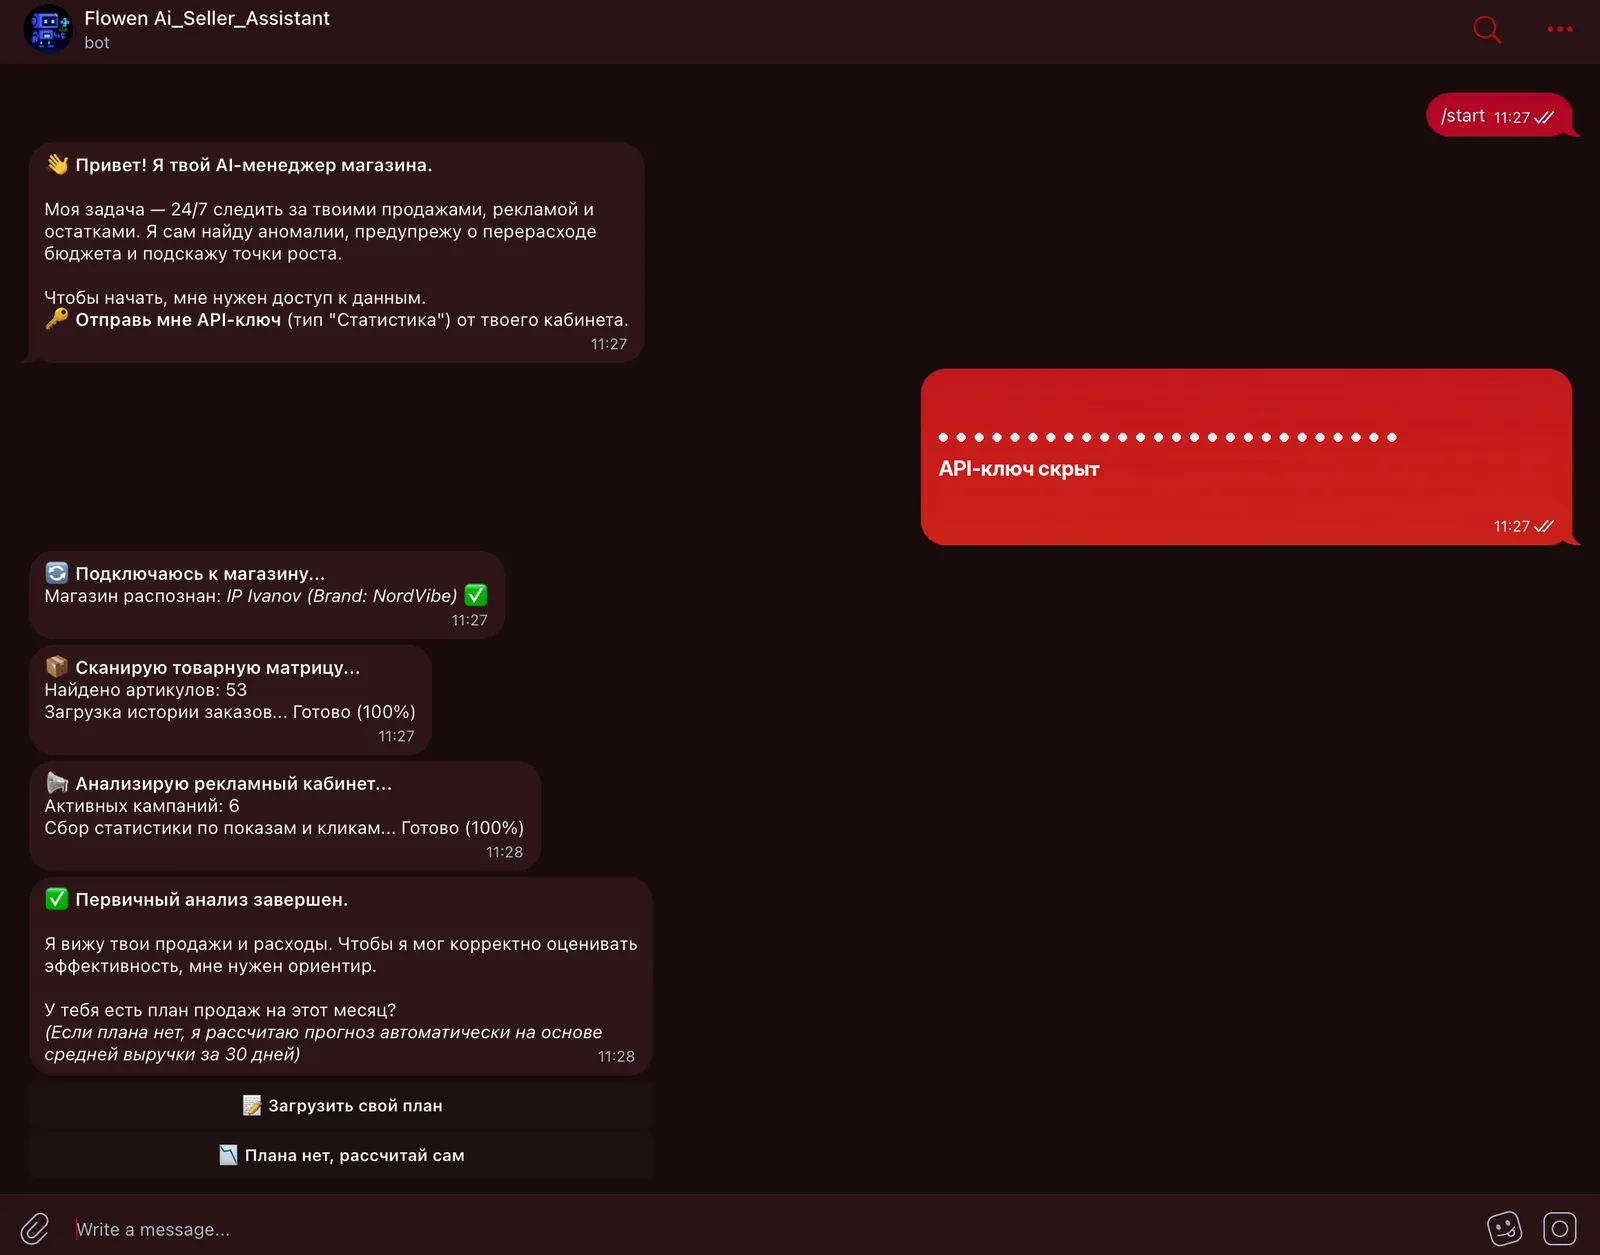
Connecting a store: the bot finds the SKUs and loads order history and ad stats
Step 1

Collects data

Core data — sales, orders, returns, stock, and finances — comes through the official Wildberries API. Whatever the API doesn’t provide (the product card funnel, search queries, ad details), the system pulls from the seller account through the seller’s authorized session and the reports they upload. Data is collected on a schedule, for example in the morning, afternoon, and evening.
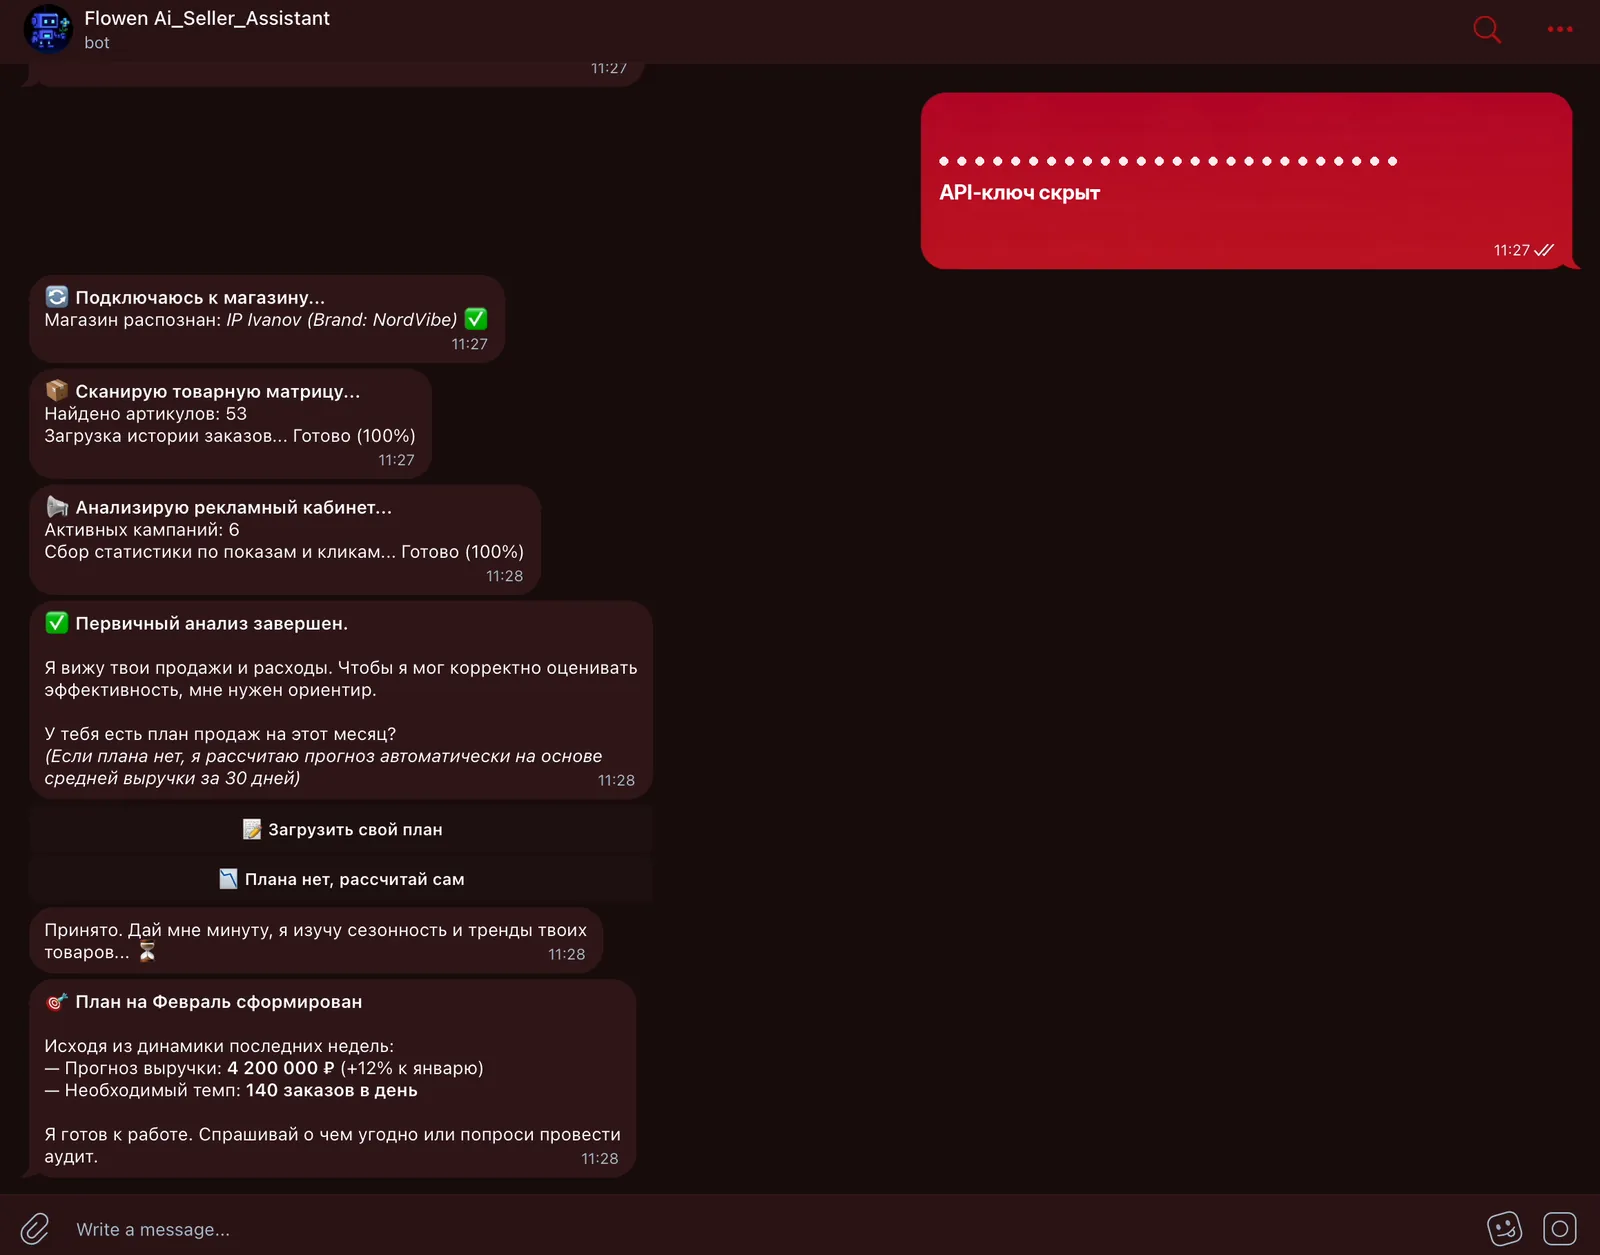
Monthly plan: revenue forecast and the order pace needed to hit it
Step 2

Calculates and compares

From that data, the system calculates more than 60 metrics: the sales funnel (impressions, clicks, add-to-carts, orders), conversion rates, ad metrics such as advertising cost of sales (ACoS) and return on marketing investment (ROMI), and margins after commissions and logistics. Each metric is compared against four baselines — the seller’s plan, yesterday, last week, and the previous summary — so you see not just the number but where it’s heading. The system also reconciles its numbers with the Wildberries sales report and warns you if they diverge by more than 5%.
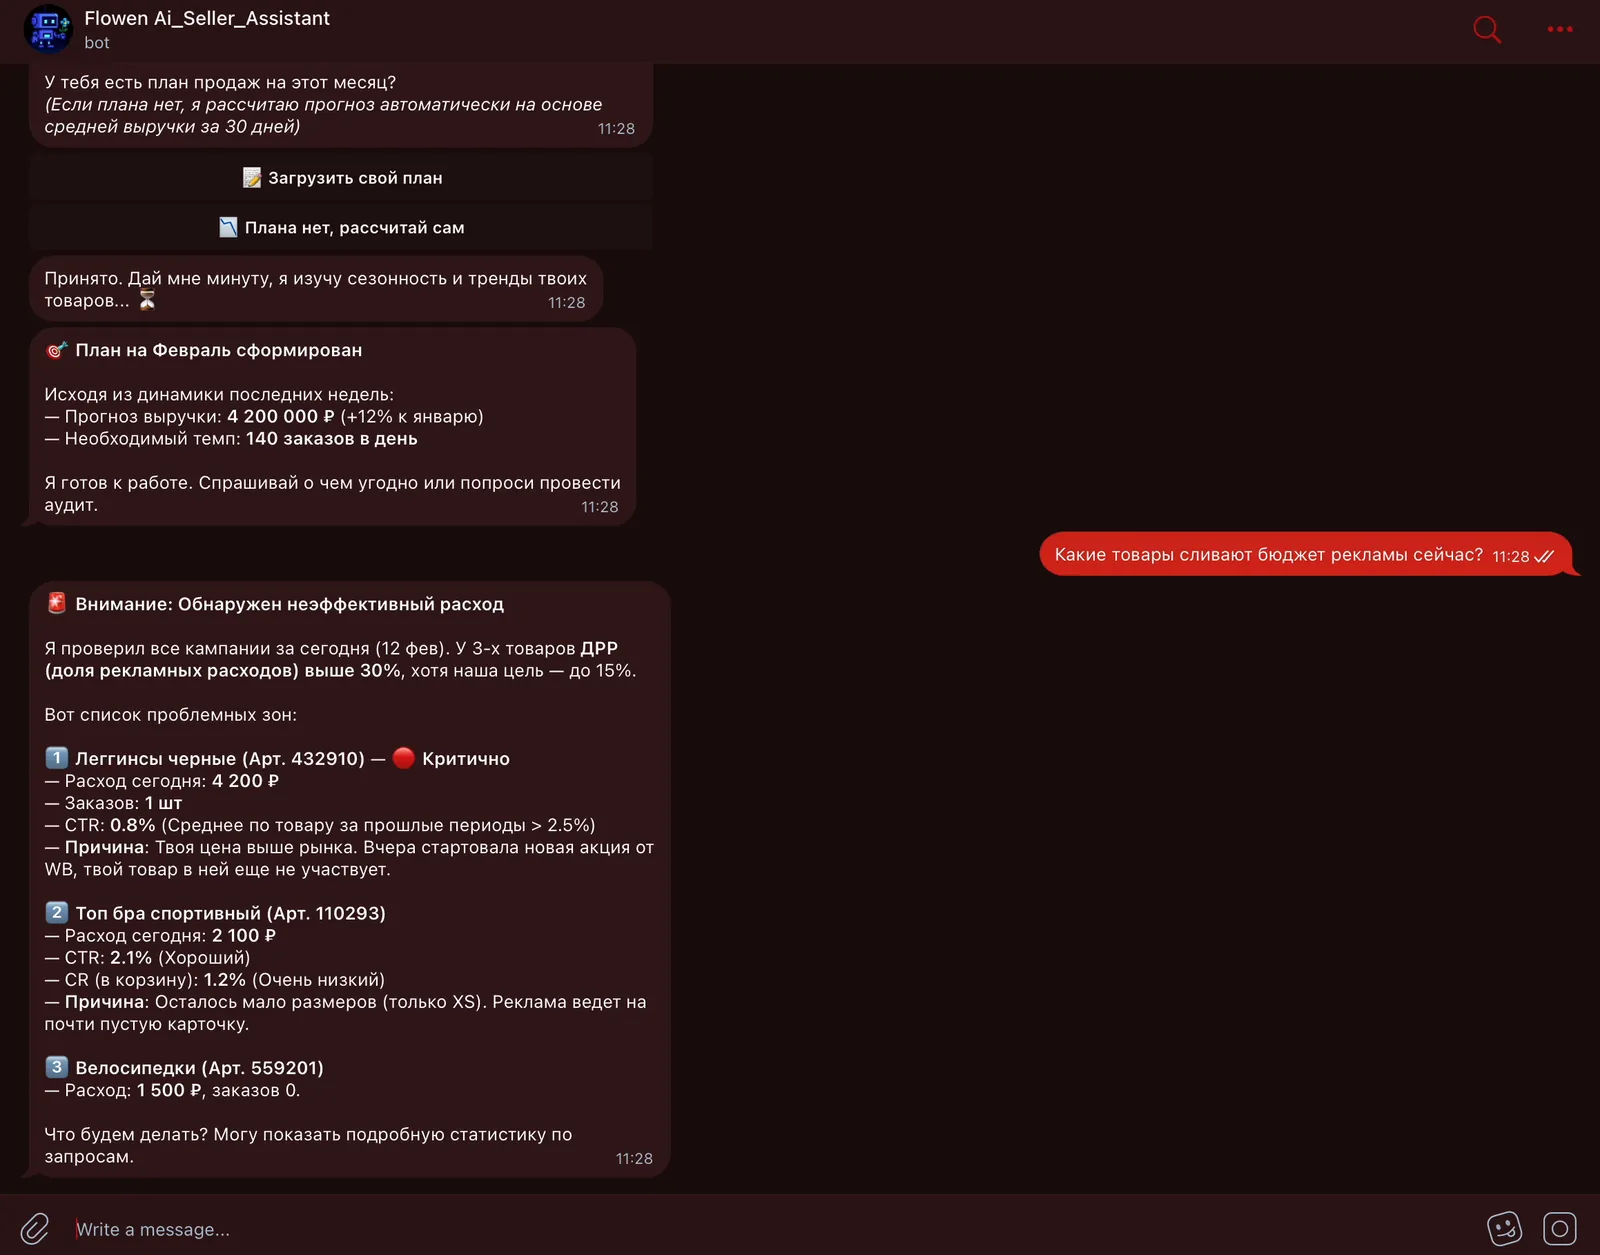
Problem summary: products with inefficient ad spend, and why
Step 3

Flags what matters

To avoid flooding the seller with alerts, the system compiles the day’s top problems and ranks them by revenue impact, so the costliest issues come first. Sellers set the thresholds for what makes it into the summary, and a filter weeds out false alarms: brief spikes and repeat alerts about the same problem.
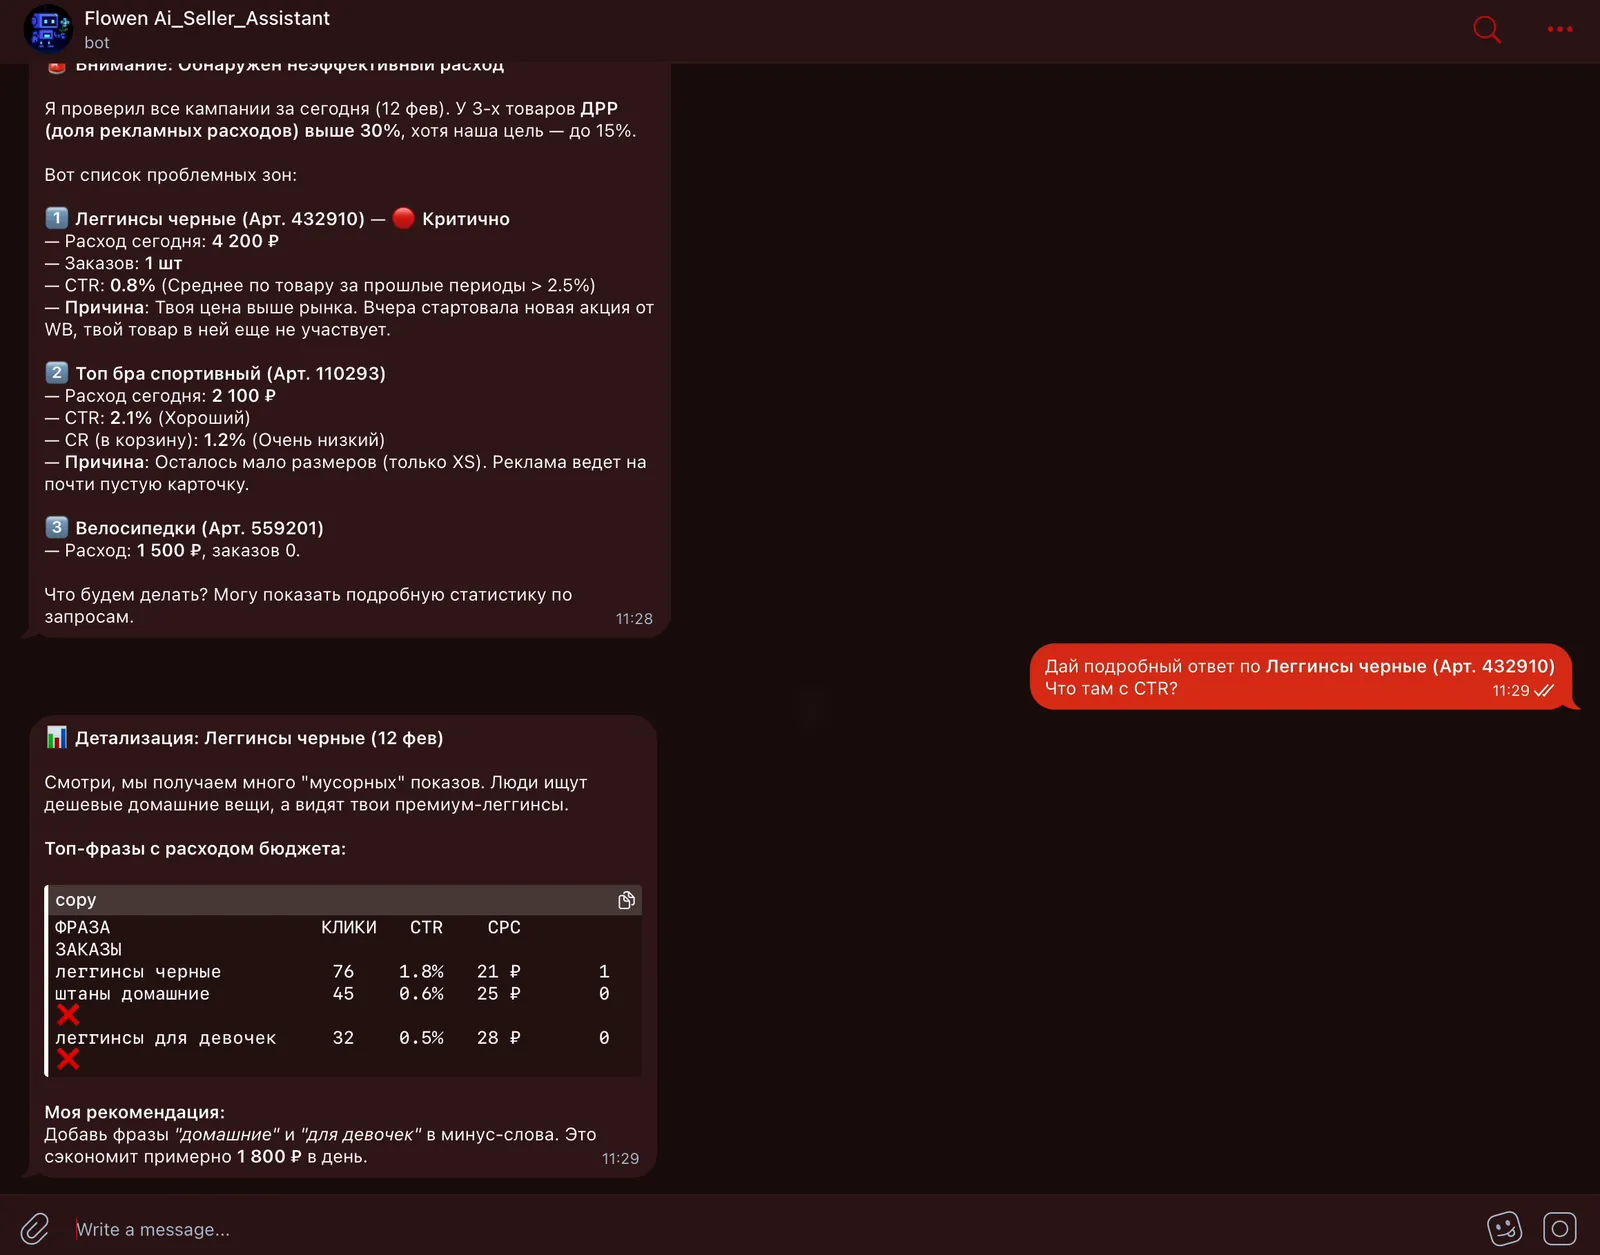
Product drill-down: search terms with ad spend and a recommendation
Step 4

Explains and answers

For each anomaly, the system builds a hypothesis strictly from that seller’s data — no generic advice — and suggests next steps. Say the seller asks in the chat, “Why did footwear sales drop yesterday?” The system breaks the drop down by brand and product, all the way to a specific item. It answers from real data only and doesn’t make up numbers.
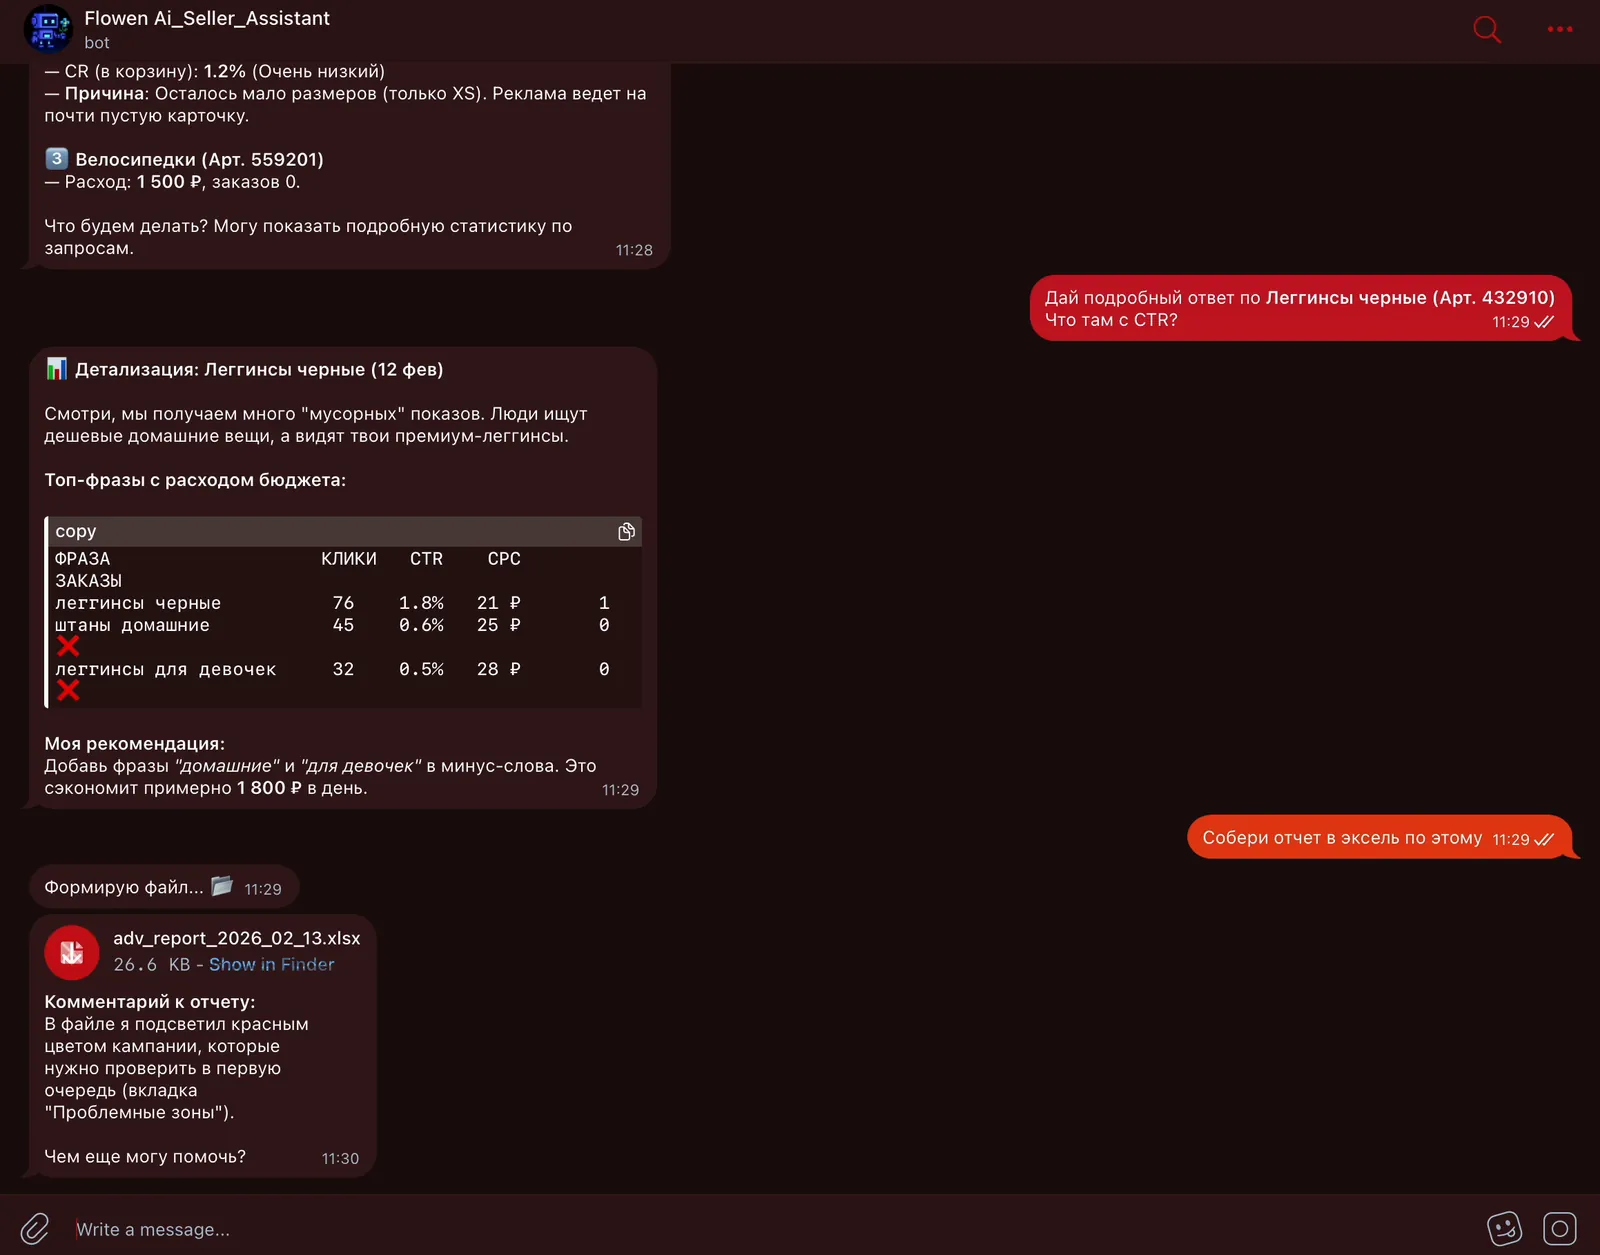
More screenshots

Excel report built on request in the chat
04 · Tech stack

Stack and approach

Python + FastAPI
The core of the system: collects data, calculates metrics, and powers the bot
WB Seller API + Playwright
Data access: the official Wildberries API, plus automated login to the seller account for whatever the API doesn’t cover
PostgreSQL
The database: stores 90 days of metric history
LLM
Explains anomalies and answers questions in the chat
Telegram bot + Google Sheets
The channel where summaries arrive and the spreadsheet where sellers set their plan and thresholds

Also used: Celery + Redis — scheduling and background jobs · matplotlib and plotly — charts for the summaries

How it works

Sources · scheduled
WB Seller API
sales, orders, stock, finances
WB seller account
Playwright: funnel, search, ads
PostgreSQL
90-day history
Calculation
60+ metrics
4 breakdowns
Comparison
plan, yesterday, last week, prior summary
Check against WB sales report
5% discrepancy threshold
Problem detector
Thresholds and plan
Google Sheets
Ranked by revenue impact
spike and repeat filter
Output
LLM
hypothesis and next steps from seller data only
Summary and chat
Telegram
05 · Results

What the client got

Sellers no longer export reports and stitch them together in Excel: the data, explanations, and recommendations arrive ready to use.

60+
metrics calculated automatically
>5%
gap vs. the Wildberries report triggers a warning
90
days of history stored for every summary
The day’s top problems are ranked by revenue impact
The chat analyst answers from real data, down to a single product
Data is stored in Russia, and access tokens are encrypted
06 · For your business

Who else this works for

The same approach works for anyone who handles large volumes of data and analytics.

Sellers and retail
A daily summary of sales, stock, and advertising that highlights anomalies, compares results with the plan, and explains the causes
Manufacturing and logistics
Tracking warehouse, delivery, and lead-time metrics, with anomaly alerts and a list of the day’s top problems
Marketing agencies
Metric tracking across client projects, plan-vs-actual comparisons, and ready-made commentary on the numbers for each client
Financial and service companies
A summary of key metrics by department and location, with explanations wherever results are off plan

We build solutions like this around your needs: turnkey AI products, AI agents and automation, integrations, and data.

Our services
Get in touch

Want results like these?

Tell us about your project — we’ll talk it through and show you how to make this work for your business

We’ll set up a short call
We’ll scope your task and estimate it within 1 business day
You’ll get a clear implementation plan and transparent pricing
Alexander Yarygin
Founder, Glake
Replies personally
What can we help with?
Select one or more
or
Chat on LinkedIn

More case studies

AI news agent for sellers
DevelopmentMarketplaces

AI news agent for sellers

A daily digest of 50+ marketplace Telegram channels: no ads or duplicates, rated by importance

MPstats
AI sales assistant for technical products
DevelopmentB2B trade

AI sales assistant for technical products

Picks gases and equipment by spec, finds alternatives, and creates CRM deals in three channels

S-GAS
AI assistant for a document management system
DevelopmentDocument management

AI assistant for a document management system

Plain-language reports and semantic document search in one chat that respects access rights

NDA
All case studies